Technical analysis stands at the core of every strategic decision in the forex market. Price movements, volume behavior, and market structure often provide insights that economic data alone cannot. The right analytical software helps traders interpret market signals with precision, test hypotheses, and execute trades based on quantifiable setups. A reliable platform must offer charting flexibility, accuracy in data feeds, and a range of customizable tools that adapt to different trading approaches.
Professional traders rely on these systems not just to read charts but to manage risk, compare market conditions, and identify price patterns. From swing strategies to scalping, every trading style benefits from a setup that can display multiple timeframes, indicator combinations, and backtesting functionality without technical delays.
What Makes a Good Technical Analysis Platform
Selecting the right platform requires attention to detail. A solid solution combines data reliability with analytical depth, allowing traders to interpret short- and long-term price cycles with consistency. The ideal software integrates live quotes, diverse order types, and real-time alerts within a clean interface that does not lag during market volatility.
Equally important is compatibility with third-party scripts and APIs. These integrations expand analytical capacity, allowing custom indicators, alerts, or automation logic. A trader who depends on Fibonacci retracements or Ichimoku Clouds must have a stable environment where visual tools respond instantly.
Some prefer platforms with community-developed resources, while others choose closed systems focused on precision and stability. The selection often depends on trading frequency, risk tolerance, and the type of instruments being analyzed.

Key Tools Traders Should Look For
When assessing software for chart-based decision-making, several tools and functions make the difference between average and advanced analysis:
| Tool/Feature | Purpose | Typical Use in Forex |
| Real-time charting | Displays live price movement | Spotting short-term momentum |
| Multi-timeframe analysis | Links several intervals at once | Confirming trends on higher timeframes |
| Custom indicators/scripts | Enables personal strategy integration | Building proprietary setups |
| Drawing instruments | Highlights patterns or zones | Marking support/resistance and channels |
| Data export & API access | Connects external systems | Automated logging or statistical modeling |
A well-built system allows multiple chart layouts, flexible zooming, and synchronized crosshairs. These seemingly small details speed up comparison and keep focus on price action rather than interface management.
Traders also value alert systems triggered by indicator values, trendline breaks, or price levels. Such alerts free up screen time while maintaining situational awareness during active sessions.
Core elements that improve accuracy
- Data precision — even a minor delay in feed delivery can distort readings, especially for high-frequency setups.
- Latency control — servers and local execution speed must align to prevent mismatched quotes.
- Template saving — storing preferred indicator configurations reduces repetitive setup time.
- Custom scripting — access to languages like MQL4, Pine Script, or cAlgo adds flexibility.
- Multi-asset access — ability to analyze forex pairs alongside commodities or indices enhances market correlation studies.
Top Forex Platforms Known for Technical Analysis
In the forex sector, several names consistently rank among professionals for their analytical strength. They differ in interface design, scripting logic, and market integration but all offer reliability and strong visualization. Below are five systems traders frequently select when building a data-driven workflow.
MetaTrader 4
MetaTrader 4 (MT4) remains one of the most established platforms in currency trading. Its layout combines simplicity with depth, supporting numerous chart types and over 30 built-in indicators. The software’s strength lies in stability and the ability to run Expert Advisors (EAs), automated systems written in MQL4.
The interface supports multiple order types, timeframes from one minute to monthly charts, and one-click execution. Traders can download or code custom indicators, turning the terminal into a specialized analytical workstation.
Advantages of MT4 for technical analysis:
- Robust set of trend and oscillator indicators
- Easy-to-modify templates for different pairs
- Strong community sharing thousands of custom scripts
- Lightweight system performance even on older hardware
MetaTrader 5
MetaTrader 5 (MT5) builds upon its predecessor with a more advanced infrastructure and multi-asset capability. The system supports forex, stocks, and futures within one interface. It features a faster strategy tester, more indicators, and a broader range of order types.
The MQL5 scripting environment enables more complex algorithms and improved backtesting precision through multi-threaded processing. This difference makes MT5 especially suitable for those developing automated trading models or working with diverse instruments.
Key highlights include:
- 38 built-in indicators and 44 analytical objects
- Economic calendar integration
- Depth of Market (DOM) window
- Optimized strategy tester with visual mode
Traders seeking more analytical detail often migrate to MT5 for its improved order execution model and compatibility with 64-bit systems, allowing smoother multitasking across markets.
TradingView
TradingView has become one of the most recognized tools for chart-based analysis. Its web-based interface combines flexibility with accessibility, allowing traders to work directly from any browser without installation. What makes it distinctive is the use of Pine Script, a proprietary coding language that lets users design indicators, alerts, or automated systems.
The platform includes hundreds of built-in tools and gives access to thousands of community scripts. This ecosystem allows for experimental setups and continuous strategy refinement. Its charts are dynamic, supporting multiple layouts, synchronized cursors, and overlay comparisons between assets or timeframes.
Key characteristics of TradingView:
| Feature | Description |
| Indicators | 100+ built-in; thousands of custom community scripts |
| Chart Types | Candlestick, Renko, Heikin-Ashi, Line Break, Point & Figure |
| Collaboration | Idea sharing and public watchlists |
| Scripting Language | Pine Script |
| Access | Web, desktop, and mobile apps |
Traders value TradingView for its cloud-based synchronization — all settings, alerts, and layouts remain stored online. Its extensive market data coverage also makes it practical for those following multiple forex pairs and indices simultaneously.
cTrader
cTrader is known for its clean interface and institutional-grade execution. It integrates directly with ECN brokers, providing transparent order books and accurate pricing. The software is built for traders who rely on both manual precision and automation via cAlgo, its native coding environment.
Charts in cTrader are highly responsive, with adjustable timeframes down to tick data. The layout supports detachable charts, allowing traders to organize several monitors efficiently. Built-in depth-of-market views and advanced order types (like Market Depth and Volume Profiles) make it suitable for active short-term trading.
Notable tools in cTrader:
- Advanced Charting – Over 70 technical indicators and smooth zooming between intervals.
- Automate Tab – Dedicated workspace for coding cBots and indicators using C#.
- Level II Pricing – Shows real-time liquidity and spreads from connected liquidity providers.
- Fast Execution Engine – Especially valuable for scalpers and high-frequency traders.
NinjaTrader
NinjaTrader targets professionals who combine discretionary and systematic methods. It is widely used in futures and forex markets due to its depth of backtesting tools and custom automation framework. The system offers tick-level data for accurate historical testing and allows full strategy optimization using multiple variables.
Unlike many competitors, NinjaTrader provides complete control over order routing, simulation, and position management within one terminal. It also supports advanced trade management functions like auto-breakeven or trailing logic.
Highlights of NinjaTrader for technical analysis:
- Over 100 preinstalled indicators and flexible chart scripting through NinjaScript (C#)
- Market Replay tool for simulating past price action tick by tick
- High customization for order entry and chart display
- Integration with external market data providers such as Kinetick and CQG
Comparing Charting Tools and Indicators
Different platforms approach charting and indicators through unique architectures. While some emphasize simplicity and visual fluidity, others prioritize scripting and data access. The decision often depends on how much customization or automation a trader requires.
A quick overview of comparative characteristics:
| Platform | Customization Level | Indicator Variety | Automation Support | Ease of Use |
| MetaTrader 4 | Moderate | 30+ built-in | Strong (EAs) | Very user-friendly |
| MetaTrader 5 | High | 80+ combined | Advanced (multi-threaded) | Moderate |
| TradingView | Very High | Thousands (community) | Cloud scripts | Very easy |
| cTrader | High | 70+ | Via cAlgo | Moderate |
| NinjaTrader | Very High | 100+ | Deep scripting | Advanced |
Each software excels in different areas. MT4 remains reliable for straightforward manual trading, MT5 adds multi-asset functionality, TradingView dominates in collaboration and visualization, cTrader stands out for ECN precision, and NinjaTrader offers the most sophisticated strategy development tools.
Built-in Indicators vs. Custom Scripts
Built-in indicators form the foundation of quick analysis. They are pre-coded, tested, and ready to apply without programming. Moving averages, RSI, MACD, and Bollinger Bands are staples that help identify trends, momentum, and volatility zones. These are useful for beginners and for building simple strategies that don’t require deep customization.
Custom scripts, however, expand functionality. They allow traders to translate personal concepts into executable logic. For example, a trader can create an adaptive moving average that reacts to volatility or design an alert that triggers only when multiple conditions align.
Comparison overview:
| Aspect | Built-in Indicators | Custom Scripts |
| Accessibility | Instant, no coding | Requires scripting knowledge |
| Flexibility | Limited to preset parameters | Fully customizable |
| Reliability | Tested and stable | Depends on developer quality |
| Sharing | Universal | Platform-specific |
| Best For | Beginners or quick setups | Advanced strategies |
Using both types in combination often yields the best results — built-in indicators for reference and custom tools for personal refinement.
Drawing Tools, Templates, and Layout Management
Visual clarity is essential in technical analysis. Drawing tools and layout organization often determine how efficiently traders can interpret charts and detect patterns. Modern forex software provides extensive options—trendlines, Fibonacci retracements, channels, and geometric shapes—that help outline key market zones.
Good chart management also means that annotations remain synchronized across timeframes. A resistance zone marked on a daily chart should still appear accurately on a four-hour or hourly view. Systems such as TradingView and cTrader excel in this, offering automatic alignment and multi-chart synchronization.
Templates and layouts further simplify workflow. A trader can save preferred combinations of indicators, drawing styles, and chart colors, then apply them across instruments with one click. This prevents repetitive setup during active sessions and keeps the workspace consistent.
Most-used drawing features across top forex systems:
| Tool Type | Function | Common Application |
| Trendline / Ray | Define direction or momentum zones | Identifying breakouts |
| Fibonacci Levels | Measure retracement or extension | Estimating potential reversal points |
| Rectangle / Channel | Highlight consolidation or range | Visualizing accumulation areas |
| Text / Notes | Add commentary | Tracking trade plans |
| Brush / Shape | Mark zones visually | Highlighting support and resistance |
Systems with customizable templates also help traders maintain a disciplined approach by enforcing uniform chart setups for all pairs under observation.
Automation and Strategy Testing
Automation transforms technical concepts into executable trading logic. The ability to test and refine strategies before risking capital is a core benefit of a mature analysis platform. Systems like MetaTrader, NinjaTrader, and cTrader allow users to simulate trades using historical data, measuring profitability, drawdown, and execution accuracy.
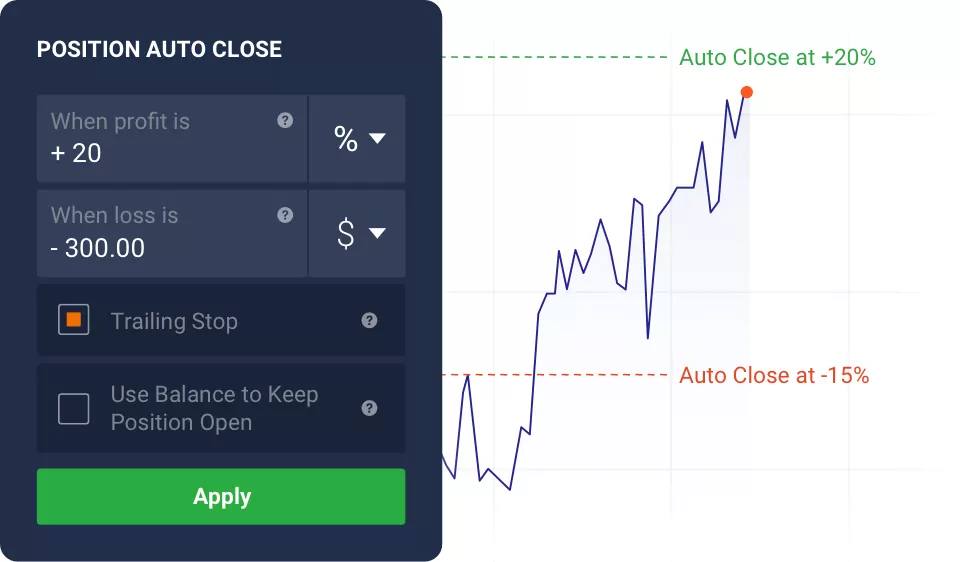
Automation does not replace manual reasoning; instead, it removes emotional bias by executing predefined rules with precision. For example, an algorithm can instantly close positions when volatility spikes or when the market crosses a moving average threshold—actions that might be delayed by manual reaction.
Using Backtesting to Refine Trading Methods
Backtesting evaluates how a trading idea would have performed in past conditions. By running an algorithm or indicator through historical data, traders can identify weaknesses before applying the method to live markets.

Reliable backtesting requires accurate tick or minute-level data. Platforms such as NinjaTrader and MT5 include integrated history databases and allow users to import external datasets. Once a backtest completes, the software generates metrics like profit factor, maximum drawdown, Sharpe ratio, and trade expectancy.
Checklist for effective backtesting:
- Use long data ranges to capture different market conditions.
- Include trading costs (spreads, commissions, slippage) for realistic results.
- Adjust timeframes to see how the system behaves under various volatility levels.
- Analyze drawdown patterns rather than only net profit.
- Re-test periodically as liquidity and price behavior evolve.
A method that shows stable performance across several years of data is generally more reliable than one optimized for a short window.
Combining Manual and Automated Analysis
A balanced workflow often merges algorithmic execution with human interpretation. Traders use scripts or EAs to handle repetitive actions—entry timing, trailing stops, or position sizing—while keeping manual control over context-based decisions like news avoidance or correlation management.
For example, a trader can set an automated alert that identifies RSI divergence but confirm the setup visually before placing a position. Similarly, an automated script can scale out of trades gradually, leaving final closure to manual judgment.
The key is designing automation that supports rather than replaces discretionary analysis. Combining both allows efficiency without sacrificing adaptability in unpredictable market conditions.
Compatibility and User Setup
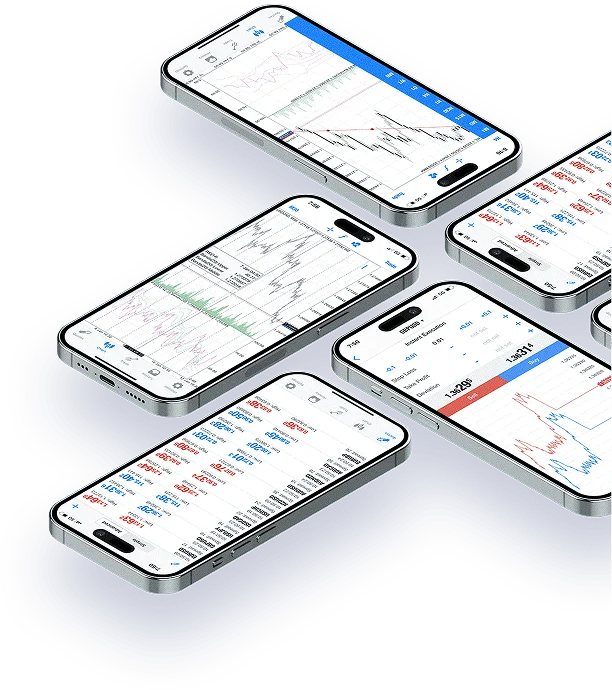
Technical analysis tools must integrate smoothly across devices. Many traders analyze charts on desktop terminals but monitor markets from phones or web browsers while away from their workstation. Cross-device compatibility ensures continuity without losing saved templates or historical data.
Most modern systems—TradingView, MetaTrader, and cTrader—synchronize settings through cloud or account-based storage. Others, like NinjaTrader, rely primarily on local files, offering full control but requiring manual backups.
Comparison of platform accessibility:
| Platform | Desktop | Web | Mobile | Cloud Sync |
| MetaTrader 4 | Yes | Limited | Yes | Partial (via broker) |
| MetaTrader 5 | Yes | Yes | Yes | Partial |
| TradingView | Yes | Yes | Yes | Full |
| cTrader | Yes | Yes | Yes | Full |
| NinjaTrader | Yes | No | Limited (3rd-party) | Local only |
For traders relying on multi-device monitoring, web-based tools or cloud synchronization are crucial. Desktop installations remain preferable for algorithmic trading, where CPU power and stability matter more than portability.
Cost and Accessibility
Price differences among analysis systems can influence long-term profitability, especially for traders using multiple subscriptions. Some programs offer strong free versions; others lock advanced analytics or data feeds behind paid plans.
Free vs. Paid Features in Technical Analysis Platforms
| Platform | Free Features | Paid Additions |
| MetaTrader 4 / 5 | Core indicators, EAs, demo access | Premium indicators or VPS hosting |
| TradingView | Basic charting, community scripts | Advanced layouts, faster data, alerts |
| cTrader | Full functionality via broker | Depends on broker license |
| NinjaTrader | Charting, simulation | Live trading license, premium indicators |
When comparing cost, traders must also consider indirect expenses—data subscriptions, VPS for continuous automation, or third-party strategy marketplaces. The ideal choice depends on whether the trader prioritizes convenience, custom scripting, or institutional-grade testing.
Tips for Choosing the Right Platform
Selecting the best software involves evaluating trading style, capital size, and technical skill. The following criteria help narrow the choice:
- Define trading goals — Scalpers need low-latency execution; swing traders value visual clarity.
- Assess scripting needs — Those writing custom indicators require open coding access.
- Check data quality — Ensure accurate tick data and consistent feed speed.
- Prioritize stability — A clean, responsive interface reduces errors under pressure.
- Test demos first — Real-time testing of features often reveals hidden limitations.
Many professionals use more than one platform: one for chart analysis (TradingView), another for execution (MetaTrader or cTrader), and a third for backtesting (NinjaTrader). Combining specialized tools can yield more accurate and confident decision-making.
Frequently Asked Questions
Which platform is best for forex chart analysis?
MetaTrader 5 and TradingView are popular for multi-asset access and visualization flexibility. cTrader is preferred for ECN transparency.


